You can check the price of a stock through the following ways:
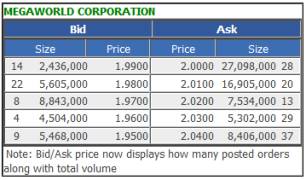
The order board or quote screen is a table that identifies the Buying (Bid) and Selling (Ask) parties into each stock reference. It lists on two main columns the desire to buy and the desire to sell, showing the respective volume levels at each price point. The sample below shows such a list.

BID Size column – how many individual buyers along with their total buying volume*
BID Price column – are the prices that buyers want to buy at
ASK Price column – are the prices that sellers want to sell at
ASK Size column – total selling volume* along with how many individual sellers
* Volume represents the number of shares being bought or sold in a queue. This may illustrate the strength of buying and selling interest and is many times used to give an impression of market force or weakness
To read a quote you first read out the best buying price and the best selling price. The first row of prices for each column represents the best bid or buyer and the best asking price or seller for the stock. Thus, in the example above of MEG the quote is: buying at 1.99 and selling at 2.00.
If you are a buyer, and would want to buy a stock immediately then you could enter a buying order at the best selling price or higher. You can post a price that is lower than the selling price in an attempt to get a better price, but you take a chance of not getting your order filled if no seller would be willing to sell it to you at that price.
Same method will be applied if you want to sell a stock. If you want to sell a stock immediately then you would enter a selling order to sell at a price that buyers are buying at or lower. You can post a price that is higher than the buying price in an attempt to get a better price, but you take a chance of not getting your order filled if no buyer would be willing to buy it from you at that price.
