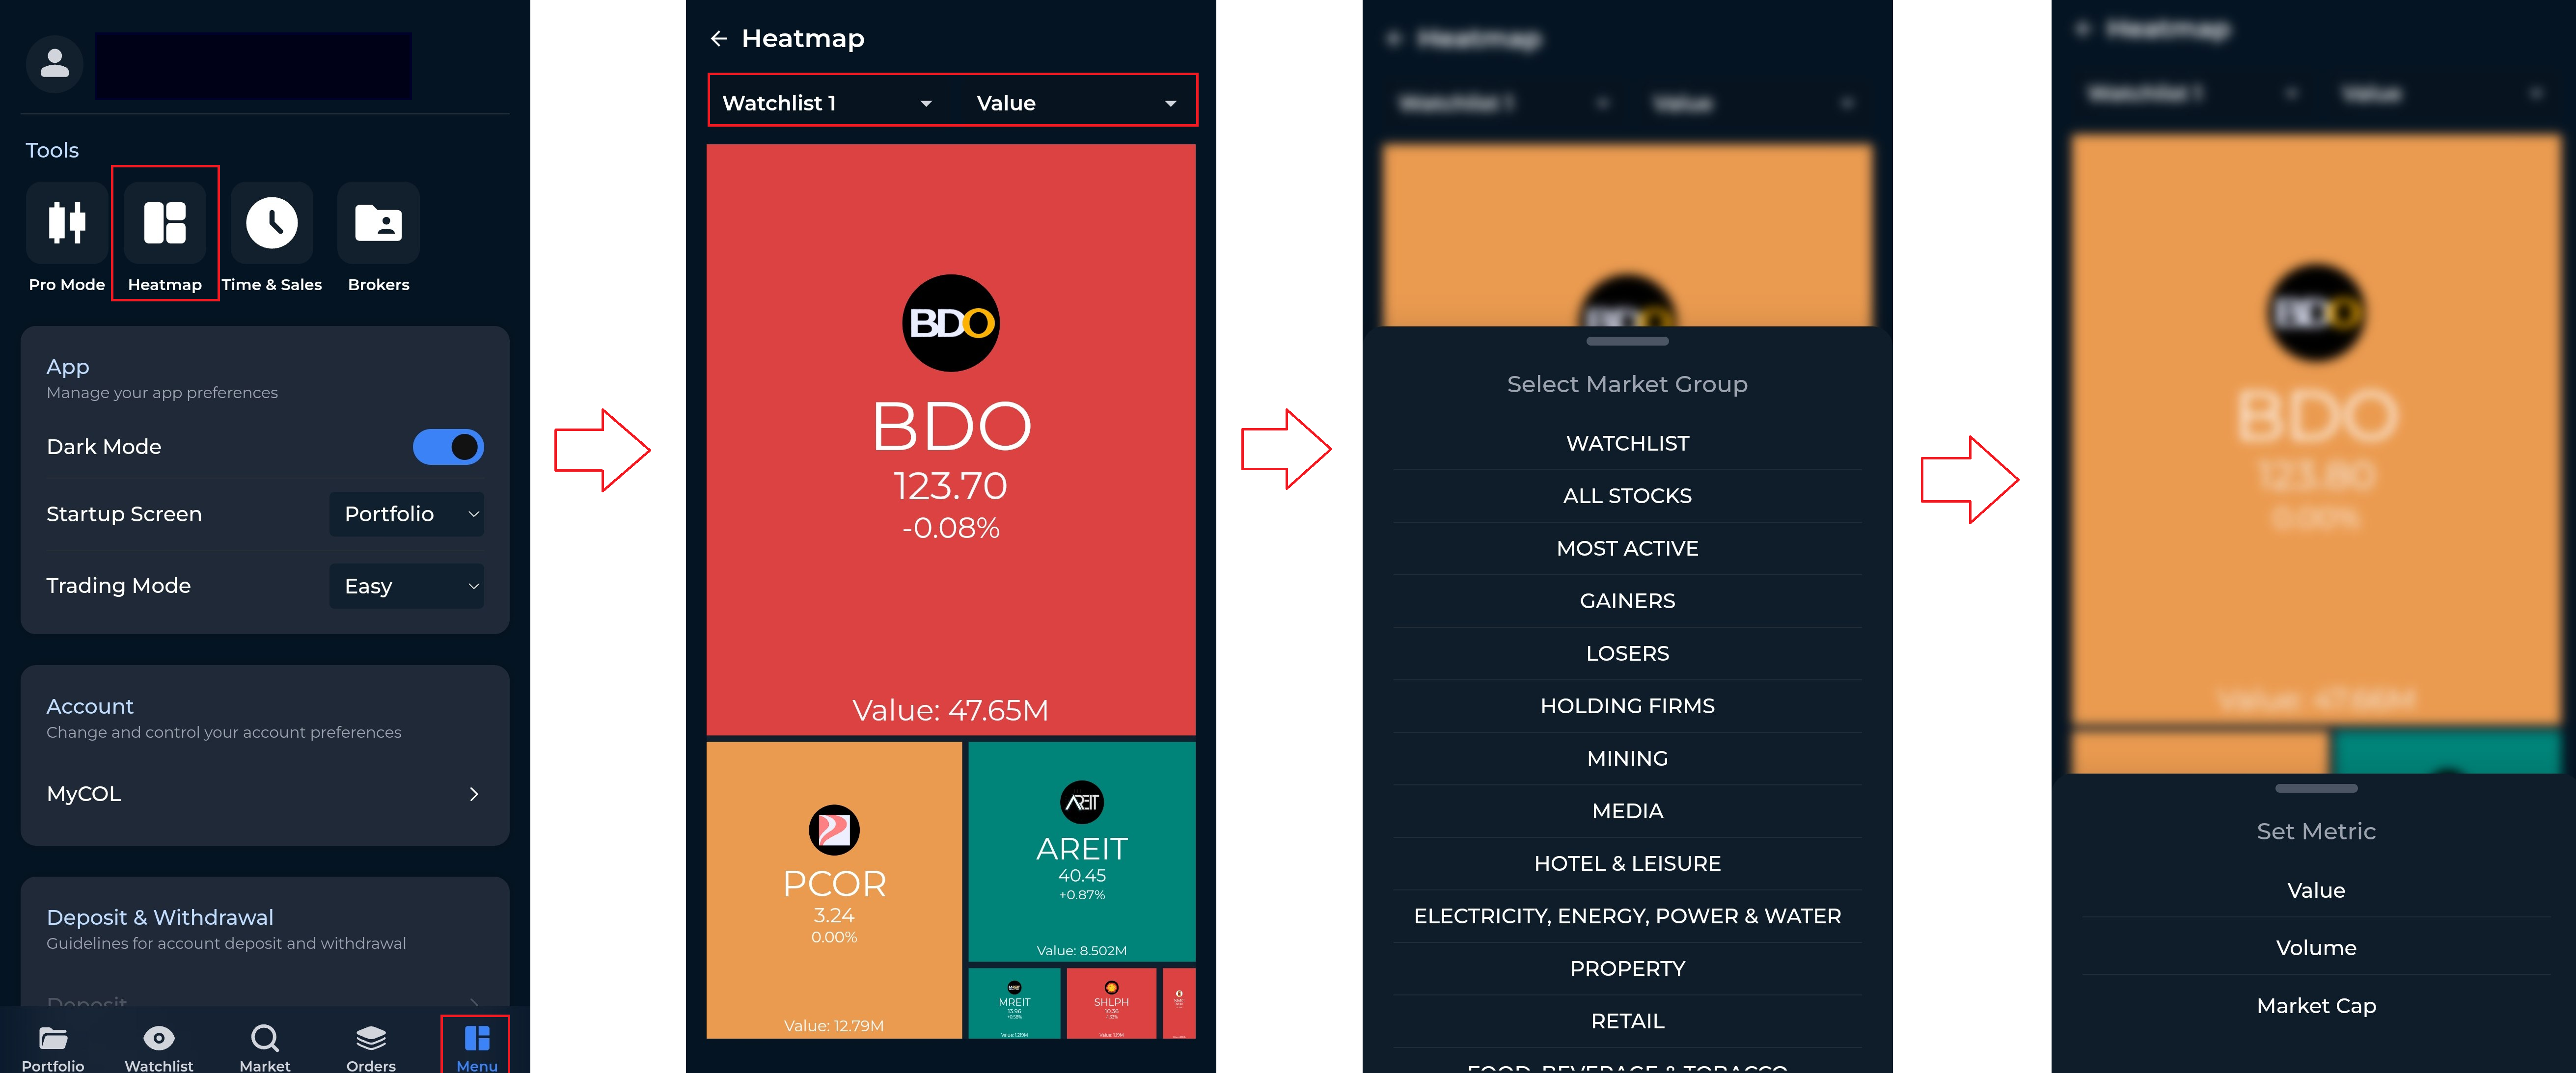
The Heatmap provides a visual overview of market performance. It helps you quickly see which stocks are gaining or losing and compare them based on metrics such as value, volume, or market capitalization.
To check the Heatmap, follow these steps:
Tap the Menu tab.
Tap Heatmap.
Select the group you want to view (e.g., Watchlist, All Stocks, Most Active, Gainers, Losers, etc.).
Choose the metric you want to display, such as Value, Volume, or Market Cap.